Table 2 Effective population size (N e ) estimated from linkage disequilibrium1 by fitting nonlinear regression model2 in a rainbow trout broodstock population3.
From: Estimates of linkage disequilibrium and effective population size in rainbow trout
Confidence interval | ||||||||
|---|---|---|---|---|---|---|---|---|
Chromosome | Number of marker pairs | Average intermarker distance (cM) | Genome coverage (cM) |
| Standard error | -95% | +95% |
|
13 | 421 | 1.16 | 5.80 | 178.56 | 75.38 | 65.77 | 448.56 | 0.56 |
14 | 8817 | 5.67 | 107.80 | 75.51 | 5.62 | 65.24 | 87.14 | 0.24 |
17 | 1499 | 7.80 | 54.60 | 122.08 | 19.16 | 89.45 | 162.23 | 0.38 |
sex | 5813 | 4.18 | 58.50 | 203.35 | 16.94 | 170.92 | 240.54 | 0.64 |
Total | 16550.00 | 18.81 | 226.70 | 579.50 | 117.10 | 391.38 | 938.47 | 1.82 |
Mean | 4137.50 | 4.70 | 56.68 | 144.88 | 29.27 | 97.85 | 234.62 | 0.45 |
SD | 57.40 | 31.30 | 50.01 | 155.77 | 0.18 | |||


- 1Pairwise Linkage disequilibrium (LD) was estimated using the ALLELE procedure of the software package SAS®, version 9.3.1 (SAS Institute 2007).
- 2The nonlinear regression model was fitted using JMP® Genomics 3.1 (SAS Institute Inc., Carey, NC, 2007),
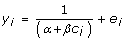
- Where
 is LD measure adjusted for chromosome sample size n, for marker pair i at recombination rate c
i
(in Morgans). The constant k had values of k = 2 for sex chromosome and k = 4 for autosomes. The c
i
's were estimates of recombination rate from two-point linkage analysis [9]. First, the e
i
residuals were estimated by non-linear fitting of the above model with JMP® Genomics 3.1 (SAS Institute Inc., Carey, NC, 2007). Then, the parameters α and β were estimated iteratively by least squares; in this model
is LD measure adjusted for chromosome sample size n, for marker pair i at recombination rate c
i
(in Morgans). The constant k had values of k = 2 for sex chromosome and k = 4 for autosomes. The c
i
's were estimates of recombination rate from two-point linkage analysis [9]. First, the e
i
residuals were estimated by non-linear fitting of the above model with JMP® Genomics 3.1 (SAS Institute Inc., Carey, NC, 2007). Then, the parameters α and β were estimated iteratively by least squares; in this model  .
. - 3Unrelated individuals (n = 96) representing the 2005/2006 brood classes were genotyped with 49 microsatellite markers.
- 4Number of potential breeders (N = 320).

 is LD measure adjusted for chromosome sample size n, for marker pair i at recombination rate c
i
(in Morgans). The constant k had values of k = 2 for sex chromosome and k = 4 for autosomes. The c
i
's were estimates of recombination rate from two-point linkage analysis [
is LD measure adjusted for chromosome sample size n, for marker pair i at recombination rate c
i
(in Morgans). The constant k had values of k = 2 for sex chromosome and k = 4 for autosomes. The c
i
's were estimates of recombination rate from two-point linkage analysis [ .
.